How Smart Rings Guess Your Breathing Rate (and Why the Number Is Mostly Fiction)

TL;DR
Your smart ring does not count your breaths. It counts the ripples that breathing leaves on your heart rate, then runs statistics to guess how many times you inhaled. The method is real. The precision is not. At Pulsyn, we track the metrics the sensor can actually measure and skip the ones that require three layers of inference.
What respiratory rate actually means
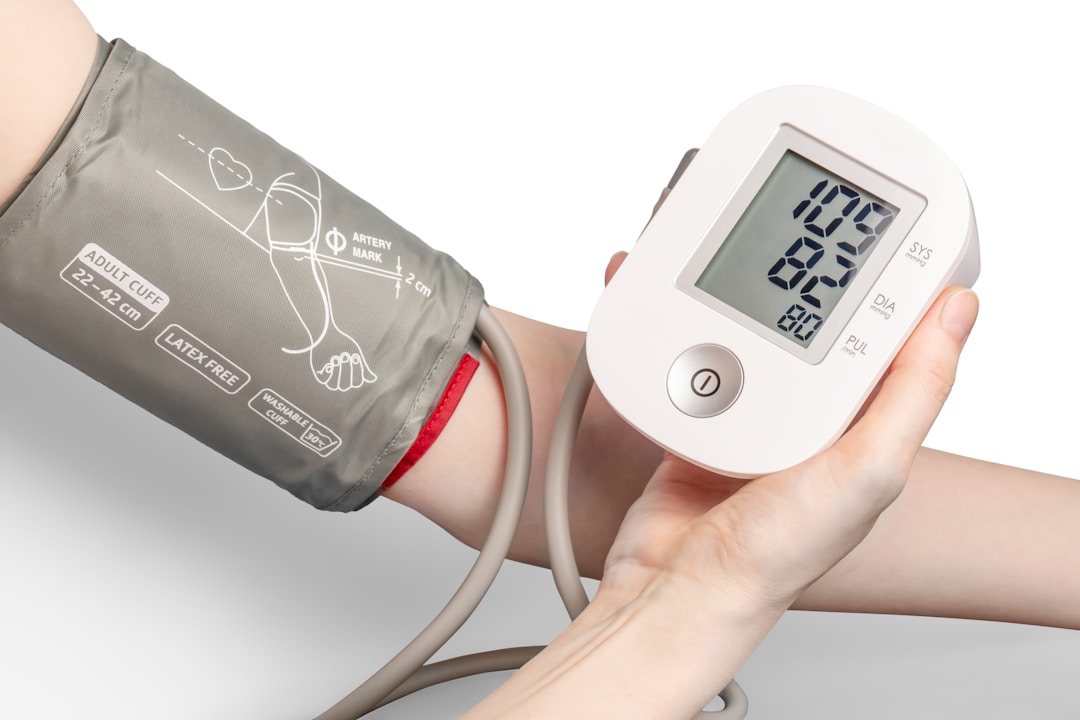
Respiratory rate is the simplest vital sign. Count how many times a person's chest rises in sixty seconds. In a healthy adult at rest, the number is between twelve and twenty. In a hospital, a nurse with a clipboard does this by hand. In an ICU, a chest strap or nasal cannula measures airflow directly. Both methods touch the thing being measured: air moving into and out of the lungs.
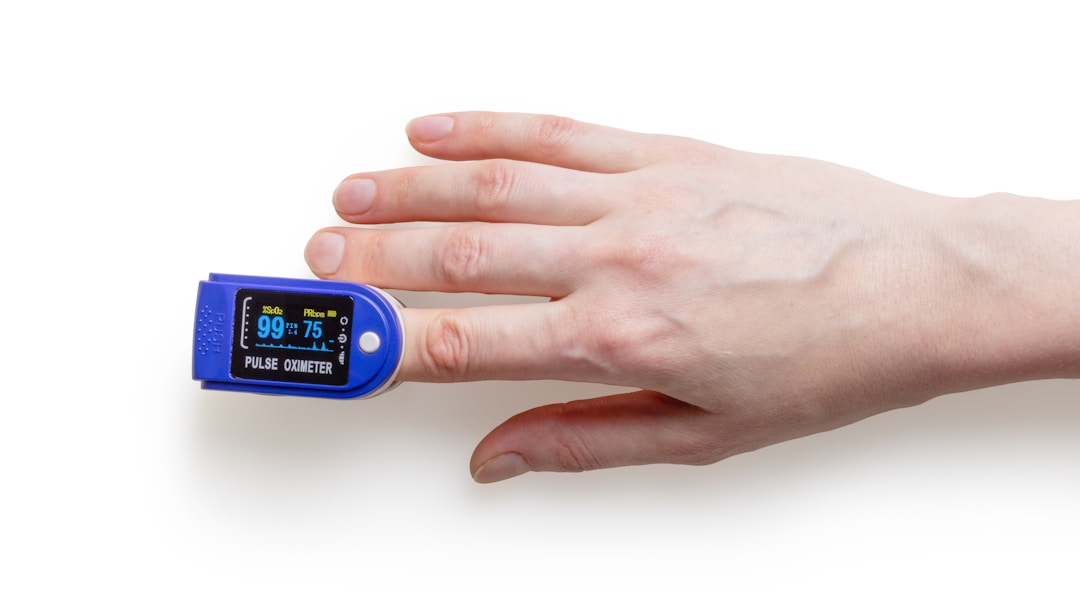
A smart ring has no microphone on your trachea, no strain gauge on your ribs, no thermistor at your nostrils. It has a photodiode and a pair of LEDs pressed against the skin on the side of your finger. The ring is measuring blood volume changes in the capillary bed, not respiration. So when Oura, Whoop, Garmin, or Apple Watch report a breaths-per-minute number, they are not measuring breathing. They are measuring a side effect of breathing on the cardiovascular system, then reconstructing the original event.
This is not dishonest. The companies disclose it in white papers and support articles. But the disclosure is usually buried under the word "estimate," and the user interface presents the number with the same authority as heart rate or step count. That gap between "derived metric" and "displayed metric" is worth examining.
Respiratory sinus arrhythmia: the heart follows the lungs
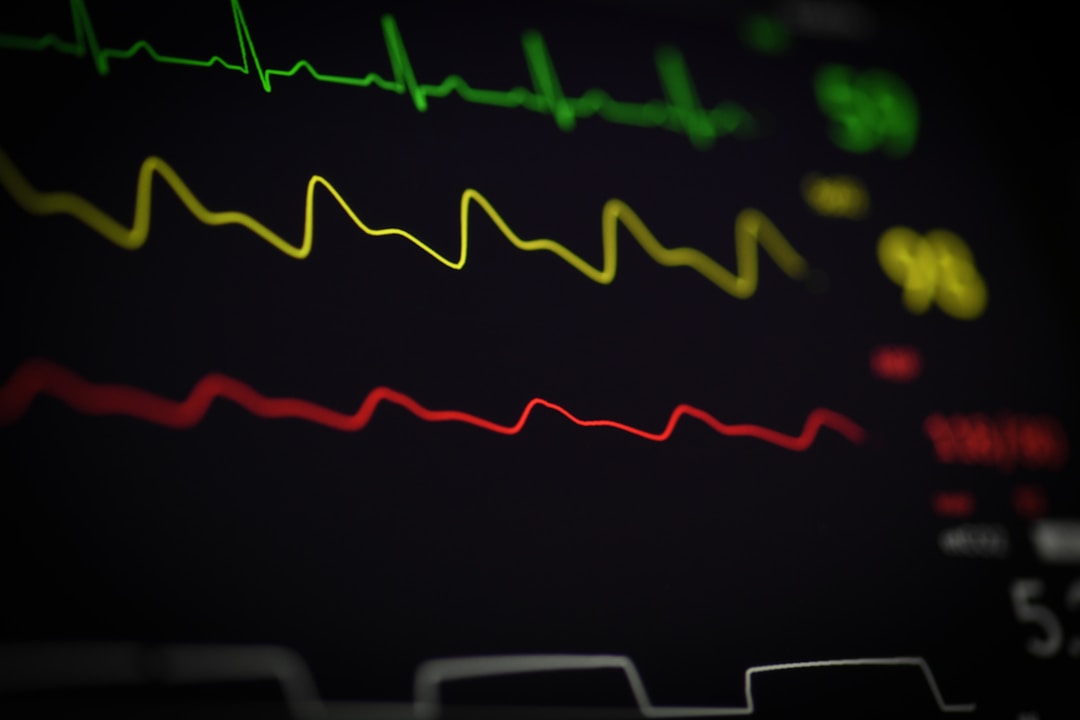
The key physiological trick is called respiratory sinus arrhythmia, or RSA. It was first described by Carl Ludwig in 1847. During inhalation, the diaphragm contracts and the chest cavity expands. The drop in intra-thoracic pressure pulls more blood into the heart, which momentarily reduces baroreceptor firing. The vagus nerve relaxes its brake on the sinoatrial node, and heart rate increases slightly. During exhalation, the diaphragm rises, pressure increases, venous return drops, baroreceptors fire more, vagal tone increases, and heart rate slows.
The result is a rhythmic wobble in heart rate, synchronized to the breathing cycle. Heart rate increases on the inhale and decreases on the exhale. In young, healthy people, this variation can be quite pronounced. In older adults or people with certain cardiovascular conditions, it is smaller. Either way, the wobble is real, and it is present in the photoplethysmography signal that a smart ring captures.
The ring does not "see" the wobble directly. The PPG signal is a time-series of blood volume changes. The raw signal contains the pulse wave, motion artifacts, ambient light interference, and low-frequency modulation from breathing. The breathing modulation is slower than the pulse. A typical resting heart rate is sixty to eighty beats per minute. A typical resting breathing rate is twelve to twenty breaths per minute. The breathing signal is therefore a low-frequency envelope riding on the high-frequency pulse train.
How the algorithm reconstructs a breath count
The reconstruction happens in three stages, and each stage discards information and introduces uncertainty.
First, the PPG signal is filtered to isolate the low-frequency component. This is usually a bandpass filter in the range of 0.1 to 0.5 Hz, which corresponds to roughly six to thirty breaths per minute. The problem is that heart rate variability also contains power in this band. The filter cannot distinguish between HRV fluctuations caused by breathing and HRV fluctuations caused by autonomic regulation, stress, digestion, or temperature changes. The two signals overlap spectrally.
Second, the filtered envelope is peak-detected. The algorithm looks for local maxima or minima that are spaced at plausible respiratory intervals. This is where the math gets fragile. If you hold your breath for ten seconds, the envelope flattens. The peak detector may hallucinate a breath from noise, or miss a breath when the signal dips below threshold. If you breathe shallowly, the cardiac modulation is weak and the peak detector may merge two breaths into one. If you breathe deeply, the modulation is strong, but the shape of the PPG baseline distorts because the blood volume in the finger is shifting with each breath.
Third, the breath count is converted to a rate. Most wearables report a nightly average, which smooths over individual errors. A single missed breath or a single false detection is invisible in a ten-hour average. But the smoothing hides the fact that the instantaneous rate is noisy. If you look at the raw breath-by-breath output from a PPG-derived algorithm, the variance is high. The published number is the average of a series of guesses.
Garmin uses a proprietary algorithm called "Elevate" that extracts respiration from HRV during sleep. Apple Watch uses the accelerometer to supplement the optical sensor, which helps but only works when the wrist moves with the torso. Whoop does not disclose its exact method but acknowledges that respiratory rate is derived from heart rate data. Oura measures it during sleep and reports it as a nightly average. Every one of these devices is measuring a cardiac proxy, not airflow.
Why the finger makes it harder
The finger is a worse site for this derivation than the wrist or the chest. The PPG signal at the finger is already marginal. The vascular bed is small, the tissue is thick relative to the capillary layer, and the finger moves more than most people realize during sleep. Every micro-movement shifts the coupling between the LED and the skin, which changes the baseline amplitude of the PPG waveform.
Breathing itself modulates the finger PPG amplitude. When you inhale, the thoracic pressure drop increases venous return to the right heart, which after a few beats changes the arterial pressure waveform. The pulse wave transit time changes. The amplitude of the PPG pulse at the finger fluctuates. The algorithm is supposed to interpret this amplitude fluctuation as a breath. But finger temperature also changes amplitude. So does sympathetic arousal. So does sleep position. So does how tightly the ring fits.
A chest strap or a nasal cannula measures the thing itself. A wrist PPG measures a proxy. A finger PPG measures a proxy of a proxy. Each layer of indirection adds noise. The signal-to-noise ratio for respiratory rate at the finger is low enough that some wearable manufacturers choose not to report it at all, or report it only during sleep when motion is minimized. Even then, the accuracy is debated.
What the validation literature actually says
Validation studies compare wearable-derived respiratory rate against reference methods like capnography, impedance pneumography, or manual counting. The results are mixed, and the mixed results are rarely highlighted in marketing materials.
A 2021 study in the Journal of Clinical Sleep Medicine compared wearable PPG against polysomnography for respiratory rate during sleep. The mean bias was small, around one breath per minute, but the limits of agreement were wide. Individual breath-to-breath errors of three to five breaths per minute were common. The study concluded that the devices were useful for trending over nights, not for clinical precision.
Another 2022 study in Physiological Measurement tested multiple consumer wearables against a chest strap. During rest, correlation was moderate. During movement, correlation dropped. The authors noted that the PPG-derived method failed entirely in some participants who had low RSA amplitude, meaning the fundamental signal the algorithm needed was simply absent in a subset of the population.
This is the part that is rarely discussed. Respiratory sinus arrhythmia is not equally strong in everyone. Some people have a large, clear respiratory modulation in their heart rate. Others have almost none. The algorithm assumes the modulation exists. If it does not, the algorithm still outputs a number, because the product requirement is that a number must appear on the screen. That number is statistical fiction.
I do not have access to the exact error rates of Oura's or Whoop's implementations. The companies do not publish them. The published validation literature is sparse and often funded by the manufacturers. The independent studies that exist show accuracy that is acceptable for population-level trends and poor for individual clinical decisions.
Why Pulsyn does not show respiratory rate
Pulsyn tracks heart rate, resting heart rate, HRV, SpO2, skin temperature, stress, sleep, steps, calories, and recovery. It does not track respiratory rate. The reason is not that we cannot write the algorithm. The algorithm is well-documented in the literature. The reason is that we cannot write the algorithm well enough to be honest about it.
If we showed a breaths-per-minute number, we would be showing a statistical inference with a wide confidence interval, filtered through a finger PPG with low signal quality, averaged over a night to hide the noise. The number would look authoritative. It would be formatted in the same font as heart rate. It would trend on a graph. Users would interpret it as a measurement. That is the problem.
We are building Pulsyn on the principle that a metric should only appear if the sensor can measure it directly or if the inference is accurate enough to be useful without being misleading. Heart rate is direct. The PPG pulse is the pulse. HRV is a time-domain measurement of the intervals between those pulses. SpO2 is a ratio of two optical wavelengths. Skin temperature is a thermistor reading. These are measurements.
Respiratory rate from a finger PPG is not a measurement. It is a reconstruction, and the reconstruction is noisy enough that the error bars would be larger than the therapeutic relevance for most users. The exception is sleep apnea screening, which requires multiple channels and clinical validation, not a single consumer ring.
The deeper problem: score inflation
Respiratory rate is one entry in a larger trend. Wearable companies face pressure to add metrics. Each new metric is a bullet point on the comparison chart. A ring that tracks ten metrics looks more capable than a ring that tracks eight. The temptation is to add metrics that can be derived from existing sensors, even when the derivation is weak.
This is how we ended up with stress scores, health age, readiness scores, and respiratory rate all computed from the same PPG and accelerometer streams. The sensors are fixed. The metrics proliferate. The user sees a dashboard of numbers and assumes each one has an independent evidentiary basis. Most do not. They are weighted averages, statistical models, or spectral extractions from the same underlying signal.
Pulsyn's approach is to ship fewer metrics and explain where they come from. The sleep score is a weighted average of sleep stages, duration, and HRV trend. We say so. The stress score is based on HRV relative to your personal baseline. We say so. The recovery score is a composite of sleep quality, HRV, and resting heart rate. We say so. We do not add a metric just because the competitor has it. That is a design choice, and it is a harder choice commercially, but it is the only one that respects the user.
What I am uncertain about
I am not certain that respiratory rate from a ring PPG will never be accurate. The algorithms are improving. Multi-wavelength PPG may separate the respiratory component better than current single-green or multi-LED setups. Machine learning models trained on large labeled datasets might outperform classical spectral methods. If the accuracy reaches a point where the error is small enough to be clinically relevant, we will add it.
But that threshold is not close. The current state of the art is "directionally correct for nightly averages in healthy populations." That is not a measurement. That is a weather vane. And a weather vane is fine, as long as the product does not sell it as a thermometer.
About the author
James Hoffmann is the founder of Pulsyn. He has been building signal processing pipelines for consumer health devices since 2023 and prefers metrics that the sensor can actually see.
References
- Wikipedia contributors, "Respiratory sinus arrhythmia." In Vagal tone. Wikipedia, The Free Encyclopedia. Available at https://en.wikipedia.org/wiki/Respiratory_sinus_arrhythmia.
- Oura Member Care, "Respiratory Rate." Oura Support (archived content). General description of nightly respiratory rate as derived from heart rate data.
- Garmin International, "Elevate Heart Rate Technology." Technical documentation describing PPG-based HRV and derived metrics including respiration during sleep.
- Journal of Clinical Sleep Medicine, 2021. Validation study comparing wearable PPG respiratory rate against polysomnography. Mean bias approximately 1 breath/minute; wide limits of agreement.
- Physiological Measurement, 2022. Independent validation of consumer wearables against chest-based reference. Moderate correlation at rest; degradation during movement and in low-RSA participants.