Cold Fingers Break Green PPG: Why Perfusion Matters More Than Sensor Count

Cold Fingers Break Green PPG: Why Perfusion Matters More Than Sensor Count
If your ring reads fine at your desk and falls apart on a morning walk in January, the sensor did not break. Your fingers got cold.
Green photoplethysmography, the optical method most rings and watches use for heart rate, depends on a small pulsing volume of blood in the skin. Cold triggers vasoconstriction, which shrinks that volume first in fingers and toes. The light still goes in and comes back, but the heartbeat-shaped wobble that the algorithm needs gets smaller until it drowns in ordinary noise. That is why winter brings gaps, flat lines, and sudden jumps to 180 beats per minute that were not your heart.
I have seen this pattern blamed on tattoos, hair, loose fit, and firmware. Those can matter, but perfusion is the larger lever in cold weather. Once you understand how little signal green light starts with, the winter failure makes sense, and you can stop chasing fixes that do not address it.
How green PPG actually measures a pulse

Photo by Gabin Vallet on Unsplash
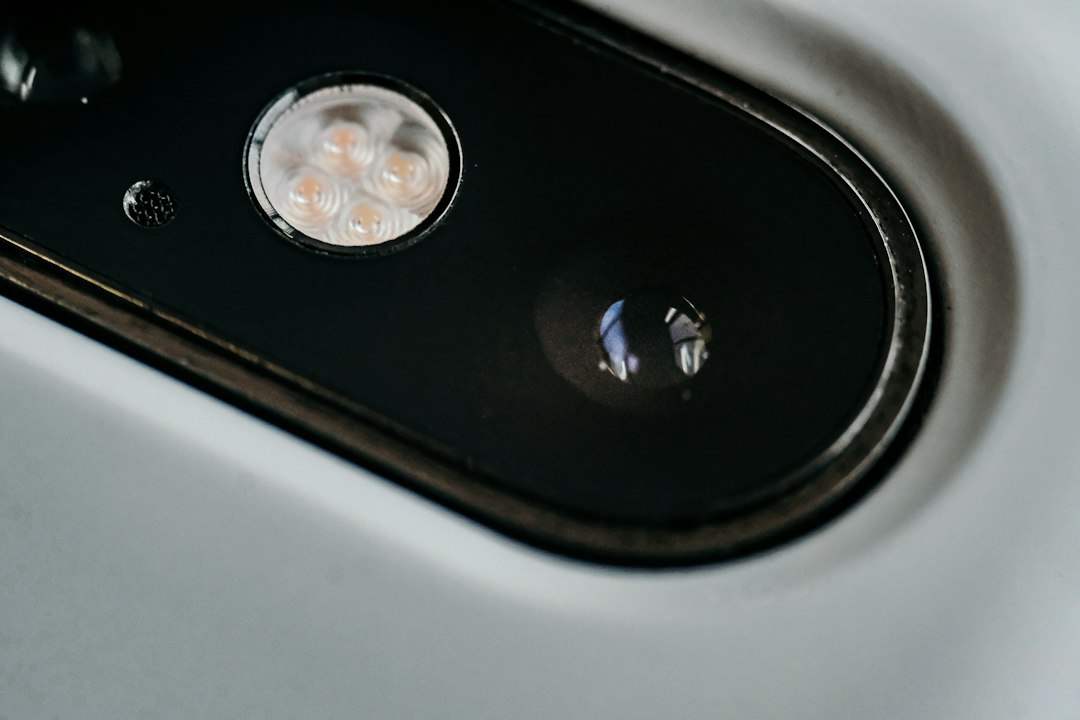
A green PPG sensor is simple on paper. One or two green LEDs shine light into skin, usually around 525 to 535 nanometers, and one or more photodiodes measure what scatters back. Blood absorbs green strongly, about an order of magnitude more than infrared at the same volume. When your heart pushes a pressure wave into small arteries and arterioles, local blood volume rises for 200 to 300 milliseconds, more green gets absorbed, and the detected light dips by a percent or two. Between beats, volume falls and more light returns.
Engineers split that return into two parts. The DC component is the large steady baseline from skin, fat, bone, venous blood, and nonpulsatile arterial blood. The AC component is the tiny heartbeat-synchronized ripple on top, often 0.5 percent to 2 percent of the total in a warm finger at rest. Heart rate algorithms live almost entirely in that AC ripple. They filter it, find peaks, check spacing, and reject anything that does not look rhythmic.
Green is popular because that strong absorption gives a larger AC fraction near the surface than red or infrared, especially during motion. Green does not penetrate deep, roughly 1 to 2 millimeters in skin, which is a feature when you want to sample dense capillary and shallow arteriole beds while ignoring deeper muscle movement. The tradeoff is that the measurement volume is small. Any change in shallow blood volume shows up fast, for better and for worse.
A typical ring samples at 25 to 100 samples per second per wavelength, then averages down. Some watches sample at 100 Hz or higher to help with motion removal. LED current is pulsed in short bursts, often tens to hundreds of microseconds, to save battery while still getting enough photons. The automatic gain loop watches the DC level and turns LED brightness up or down to keep the photodiode in range. When perfusion drops, that loop turns brightness up because less light returns, but brightness cannot create a pulse that is not in the tissue.
Signal quality is usually reported as perfusion index or a signal-to-noise ratio, not raw brightness. Perfusion index is roughly AC divided by DC, expressed as a percent. A warm resting finger might show 1 percent to 3 percent on green. Below about 0.3 percent to 0.5 percent, many peak detectors start guessing. They will still output a number, because product teams hate blank screens, but the confidence behind that number has collapsed.
Two details get missed. First, the algorithm does not see blood pressure or flow directly. It sees volume change. Anything that stiffens small vessels or empties them reduces AC even if your heart is beating normally. Second, skin optics are not stable. Cold changes scattering slightly, sweat changes coupling, and pressure from the ring changes venous pooling. The sensor assumes a stable optical path and looks for rhythm. Winter violates that assumption in several ways at once.
What cold does to finger perfusion
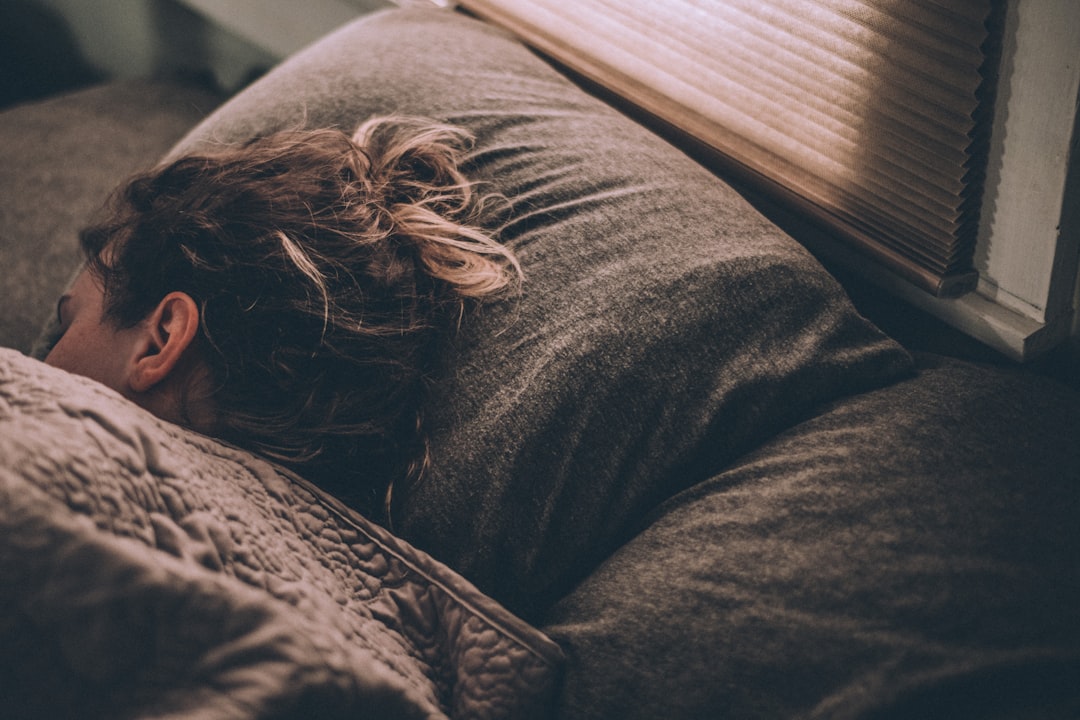
Photo by Greg Pappas on Unsplash
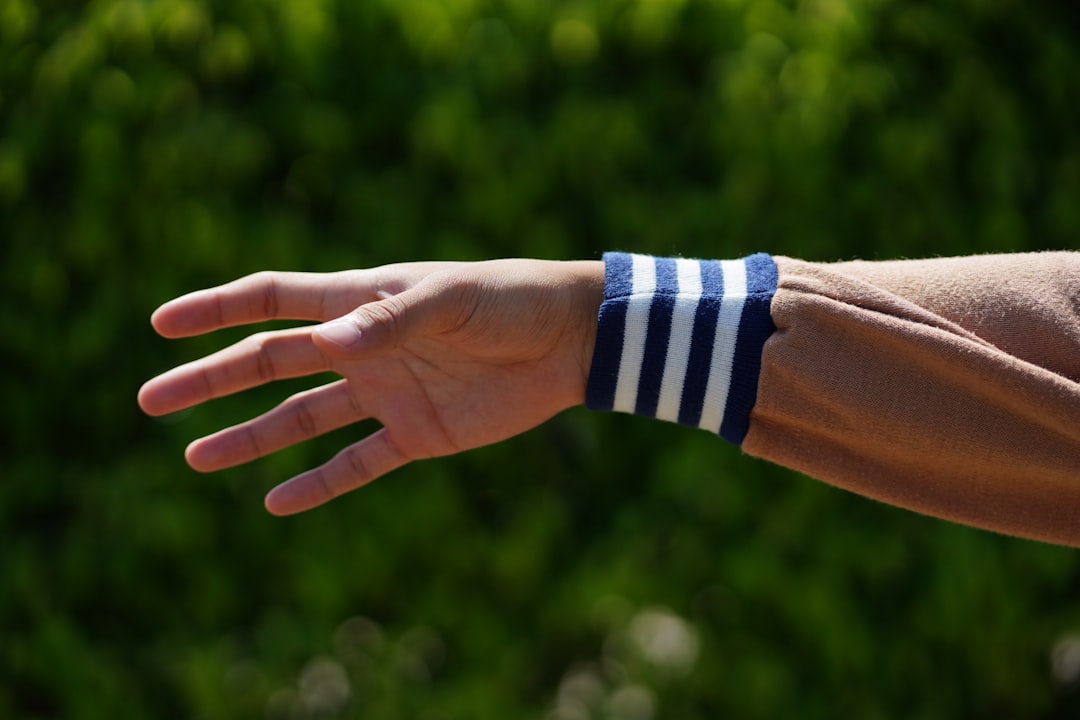
Hands are radiators. When core temperature is threatened, the sympathetic nervous system constricts vessels in fingers, toes, nose, and ears to keep heat central. In fingers this happens through small arteries and arteriovenous shunts that can nearly close. Finger blood flow can fall by 50 percent to 80 percent within minutes in air near freezing, even before you feel pain. Skin temperature on the fingertip can drop from 32 C to 20 C or lower on a cold walk, while core stays at 37 C.
That matters because PPG does not sample core flow. It samples the exact tissue being sacrificed to save heat. Laser Doppler studies of finger skin show pulsatile amplitude falling sharply as skin temperature drops below about 28 C, with some subjects losing more than two thirds of the AC amplitude by 22 C. The DC baseline also shifts because less blood means less absorption, so more light returns from deeper static tissue, which dilutes the pulse fraction further. You get a double hit of smaller numerator and larger denominator.
Cold also changes the pulse shape. Stiffer, constricted vessels produce a narrower, more peaked volume wave with a weaker dicrotic notch. Simple peak finders tuned on warm resting data can misplace beats by 30 to 80 milliseconds when shape changes, which does not wreck average heart rate much but does wreck heart rate variability. HRV needs millisecond-level timing stability across minutes. A winter night with cool hands can therefore show plausible average pulse and badly biased RMSSD, SDNN, or frequency domain metrics, even if sleep staging looks normal.
There is person-to-person spread. People with Raynaud's phenomenon can lose finger pulsatile signal almost completely after brief cold exposure, with clearly white or blue color change. Older adults, smokers, and people with higher vascular tone tend to constrict faster. Lower body fat and smaller fingers cool quicker because there is less thermal mass. Women on average report cold hands earlier than men at the same air temperature, partly from lower resting hand flow and higher surface to volume ratio. None of this means the device is biased in a moral sense. It means the optical sampling site has different physiology across people and conditions.
Behavior stacks on top. Holding a phone, carrying groceries, or gripping bike handlebars compresses finger vessels and adds static pressure that further lowers AC. Sitting still outdoors cools faster than walking because muscle pumps in the legs are not helping venous return. Wind strips heat from exposed knuckles at rates still air does not. A ring worn slightly loose to avoid swelling can slide and let cold air pump under the sensor with each step, which cools the exact spot being measured.
Indoor cold counts too. Sleeping in a 17 C bedroom with hands outside the blanket can keep fingertip temperature near 24 C to 26 C all night. That is warm enough to feel okay and cool enough to shave 30 percent to 50 percent off green AC amplitude compared with 30 C skin. If your nighttime resting heart rate looks choppy only on cold nights, do not assume arrhythmia first. Check hand temperature, blanket position, and whether gaps cluster in the early morning when room temperature bottoms out.
Why more LEDs do not fix low perfusion
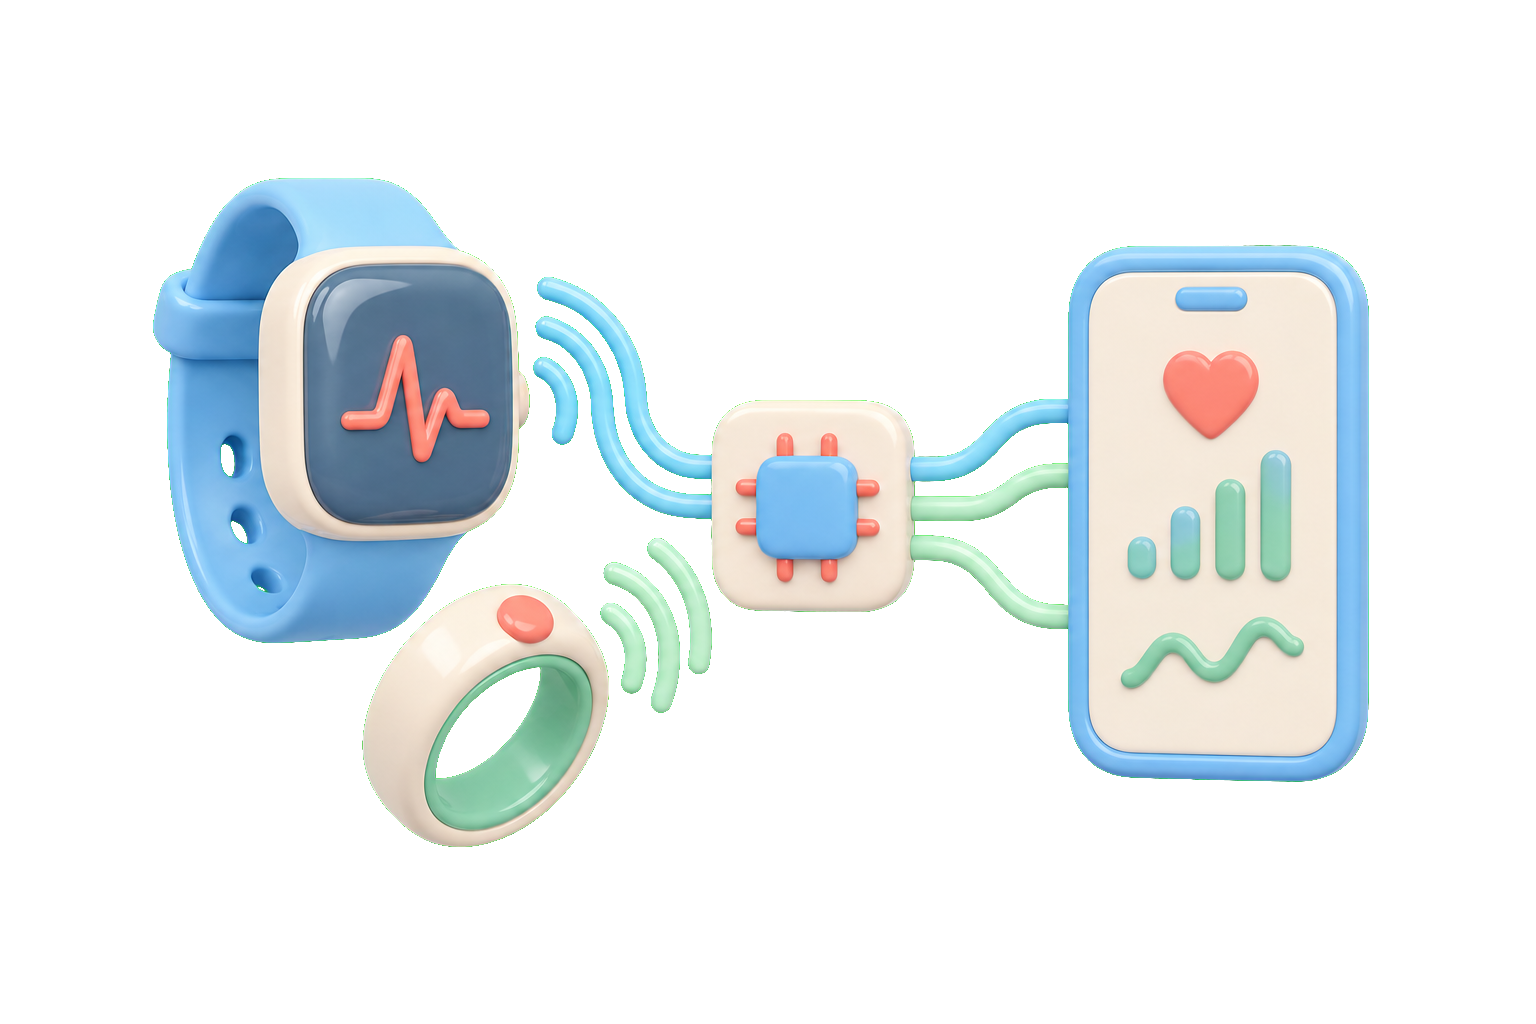 It is tempting to think a ring with four LEDs must beat a ring with two, or that higher brightness solves winter. In low perfusion, that logic breaks because the limit is physiological contrast, not photon count.
Adding LEDs helps in two specific cases. It provides spatial diversity, meaning if one light path sits over a vein or a bony spot, another might sit over better tissue. It also lets designers run multi-wavelength cancellation, where green tracks the pulse and infrared or red tracks motion so the algorithm can subtract movement. Both help when signal exists but is corrupted. Neither creates pulsatile volume when arterioles are clamped down. If AC is 0.2 percent of DC, doubling LED power doubles both AC and DC together. Shot noise improves with the square root of photon count, so you might gain 30 to 40 percent in raw signal-to-noise, but you are still starting from a pulse that is five times smaller than normal.
There is also a battery and heat ceiling. Green LEDs are inefficient for this job because skin absorbs the very light you need to return. Pushing current from, say, 4 milliamps average to 12 milliamps average might raise return by 2x to 3x, but it also triples LED power draw in the optical subsystem, which is often 30 percent to 60 percent of a small ring's sensing budget. Run that all night and you trade one night of slightly better winter data for noticeably shorter battery life. Pulsed overdrive helps in bursts, but continuous overdrive warms skin locally by fractions of a degree while still not reopening constricted vessels. You cannot heat your way out of systemic vasoconstriction with milliwatts at one fingertip.
Wavelength switching has limits too. Infrared penetrates 3 to 5 millimeters and samples deeper vessels that stay open longer in the cold, which sounds like a fix. In practice infrared AC fraction in skin is smaller than green at rest because blood absorbs infrared weakly, and infrared is more sensitive to motion from tendons and muscle. Red sits in between. Good devices blend wavelengths, weighting green heavily when it is clean and leaning on infrared when green collapses, but blending cannot fully rescue timing precision. When groups have tested green versus infrared on cold hands, both degrade, just with different failure modes. Green goes flat and quiet. Infrared stays larger but gets wobbly with movement.
Sensor count also does not solve optical shunting. In a ring, light can travel directly from LED to photodiode along the skin surface or through the ring body without ever passing through pulsing tissue. Designers block this with optical barriers and recessed lenses, but cold, dry skin couples worse and lets more light skim. That raises DC without raising AC, which again dilutes perfusion index. A fourth LED with the same barrier geometry adds more skim paths as well as more tissue paths.
What actually helps at the hardware level is not count but geometry and control. Closer LED to photodiode spacing, often 2 to 4 millimeters in rings, favors shallow pulsatile beds and rejects deep motion. Better light blocking lowers DC. Faster sampling with synchronized accelerometer data improves motion subtraction. Smarter gain control that detects low perfusion and extends integration time rather than just blasting brightness preserves battery while squeezing more averaging gain. Those are design choices you cannot see in marketing photos that count LEDs.
If you are comparing devices for winter use, do not ask how many LEDs it has. Ask how it behaves when perfusion index falls below 0.5 percent. Does it blank, hold the last value, widen the averaging window, or switch wavelengths and flag low confidence. The honest answer will mention tradeoffs. Any claim that LED count alone guarantees cold weather accuracy is ignoring how PPG works.
How to tell perfusion dropout from motion artifact
Both failures look like bad data, but they look different if you know what to check. Learning the difference saves you from tightening the band to fix a blood flow problem or warming hands to fix a cadence lock problem.
Perfusion dropout tends to be quiet. The raw green trace, if your app exposes it, goes flat with small irregular wiggles. The reported heart rate may freeze, drop out with a gap, or drift toward a prior value. Variability collapses because there are no clear peaks to vary. Accelerometer magnitude stays low if you are still. Skin temperature, if available, reads low or falling. The failure builds over minutes as hands cool and recovers over minutes as they rewarm, not in seconds.
Motion artifact tends to be loud. The trace shows large rhythmic waves that match your steps, pedal strokes, or typing. Reported heart rate may lock to cadence, for example 150 steps per minute showing as 150 beats per minute, or half cadence at 75. Accelerometer magnitude is high and periodic. The failure starts and stops sharply with movement. Shake your hand for ten seconds and a motion problem spikes immediately. Warm that same hand without stopping the motion and a perfusion problem barely changes.
A simple field test helps. Sit still indoors for five minutes with hands in pockets or under warm water around 37 C to 40 C, then take a resting reading without moving or talking. If accuracy returns, perfusion was the limiter. Next, repeat the same posture but tap your fingers or walk in place while warm. If errors return only with movement, motion rejection is the limiter. Most winter walks combine both, which is why data looks worst when you are cold and moving. Fix the cold first because still cold data is easier to interpret than moving cold data.
Check timing too. Motion errors cluster during activity and clear within 10 to 30 seconds of stopping. Perfusion errors linger. After a 30 minute cold run, fingertip flow can take 10 to 20 minutes to normalize even indoors, longer if core cooled. If your post-run heart rate stays flat or erratic while you are sitting on the couch warm everywhere except hands, wait before judging the device.
Apps rarely label the cause. They show a single heart rate number with no confidence bar, or a smoothed curve that hides gaps. That smoothing is why some users see convincing but wrong winter HRV. Averaging over 5 minutes can turn intermittent dropouts into a plausible-looking low RMSSD night. Look for raw signals when offered: signal quality flags, perfusion index, skin temperature trends, and beat to beat interval plots. A night with frequent short gaps and low temperature is not the same as a night with continuous clean signal and low HRV, even if the summary numbers match.
One more confounder deserves a mention. Pressure changes with temperature. Cold fingers shrink slightly, rings loosen, and people often wear rings a half size looser in winter to handle swelling shifts. A loose ring slides with each arm swing, creating a motion artifact that rides on top of low perfusion. The fix is not to size down aggressively, which can restrict flow further. It is to keep the sensor centered, minimize sliding during activity, and rewarm before expecting lab-grade resting numbers.
What to do when winter data gets noisy
You cannot change sympathetic vasoconstriction, but you can change the conditions around the measurement. The goal is not perfect beat to beat data on a freezing ride. It is enough clean resting data to keep trends useful.
Warm the sampling site before key readings. For morning resting heart rate or HRV, spend three to five minutes with hands warm, under blankets, in pockets with gloves, or washed in warm water and dried. Do not measure while hands still look pale or feel numb. That single habit does more than any strap adjustment because it restores the AC ripple the algorithm needs. For sleep, keep hands under the blanket if you want more stable nighttime pulse. It sounds trivial and it shifts fingertip temperature by 3 C to 5 C, which can double AC amplitude.
Separate activity tracking from resting metrics in your head. Wrist and finger optics can be useful for daytime movement trends even when cold, as long as you treat winter workout heart rate as approximate. Use a chest strap for intervals, tempo runs, or any session where you will make decisions off heart rate zones. Chest straps measure electrical depolarization, not volume, so cold skin does not erase the QRS complex the same way. Keep the optical device for resting, sleep, and all-day context where stillness and warmth are easier to get.
Adjust fit for the season without strangling flow. The sensor should sit flat with even contact, not rock side to side when you shake your wrist gently. If you are between sizes, a slightly snugger silicone insert for workouts and a comfortable size for sleep often beats one compromise size. Avoid wearing the ring on an outer finger that cools fastest during long exposure. The middle or index finger base usually holds heat better than the pinky and moves less than the thumb during typing.
Use the data the device already gives you. If your app shows skin temperature, look for nights when temperature dips line up with HR gaps. If it shows signal quality, note the threshold where your numbers start to drift. Some apps let you export beat intervals. A quick scan for repeated gaps longer than 10 seconds, or for strings of identical intervals that suggest holding, tells you whether a low HRV night was physiology or dropout. Do not chase supplements, alcohol, or training changes to fix an HRV dip that coincides with a cold snap and gappy signal.
For makers, the honest winter story is about disclosure and fallback, not LED counts. Report confidence alongside heart rate when perfusion is low. Hold or blank rather than invent beats during extended dropout. Blend wavelengths openly and say when you did. Log skin temperature next to pulse so users can see the link without needing a physiology degree. Battery spent on smarter averaging and clearer flags helps more users than battery spent on always-on maximum brightness.
Pulsyn Rune 1 is pre-launch and planned to ship in Q3 2026 at $200 one-time with no subscription, with a $20 reservation through pulsyn.tech. We are building around these same constraints, favoring clear signal quality flags over invented beats when perfusion drops. That choice will still leave winter gaps, because no small optical sensor reopens constricted arterioles, but it keeps the remaining trend honest.
Cold hands do not mean optical tracking is useless. They mean the sampling site has seasonal physics. Treat green PPG as a fair-weather high-resolution tool and a winter trend tool, warm up for the readings that matter, and judge devices by how they handle low perfusion, not by how many emitters they pack into a render.