Recovery, Readiness, and Strain: Why Your Wearable Gives You Three Scores for the Same Inputs

TL;DR
Oura calls it Readiness. Whoop calls it Recovery. Garmin calls it Body Battery. They all pull from the same three inputs: your heart rate variability, your sleep duration, and your resting heart rate. The names are different because the marketing departments are different. The math is nearly identical because the sensors are identical. Pulsyn does not compute a proprietary recovery score because we think giving you a black-box number based on data you already own is insulting.
What the three scores actually are
Oura Readiness is a 0 to 100 score that appears every morning. It is computed from your overnight HRV, your sleep data, your resting heart rate, and your body temperature trend. Oura published a white paper in 2021 that describes the algorithm in vague terms. They do not publish the exact weights or the formula. A score above 85 is "optimal." A score below 60 is "pay attention." Those thresholds are arbitrary, but they feel authoritative because they are numbers.
Whoop Recovery is also a 0 to 100 score. It is computed from your HRV, your resting heart rate, and your sleep performance. Whoop does not include body temperature because the strap does not measure it. Whoop says the score is "a measure of your body's return to its baseline." The baseline is a rolling average of your HRV and resting heart rate over the past 30 days. A score above 67 percent is "green." Below 33 percent is "red." The color coding is the same as their strain score, which is confusing because recovery and strain are supposed to be opposites.
Garmin Body Battery is a 0 to 100 score that tracks your "energy reserves" throughout the day. It is computed from your HRV, your sleep data, your stress levels, and your activity. Garmin does not call it recovery or readiness. They call it energy. The inputs are still HRV, sleep, and heart rate. The Body Battery drains during the day as you move and fills during the night as you sleep. The rate of drain is supposed to reflect your autonomic load. The rate of fill is supposed to reflect your sleep quality. Both are estimates derived from the same optical sensors.
The common thread is obvious. All three devices measure the same physiological signals. All three reduce those signals to a single integer. All three wrap that integer in a brand name that sounds like it came from a focus group. Readiness sounds like a military term. Recovery sounds like a medical term. Body Battery sounds like a consumer gadget term. The naming is not accidental. It is segmentation. Oura sells to biohackers. Whoop sells to athletes. Garmin sells to general consumers. The product is the same. The label is different.
What actually goes into the black box
If you strip the marketing, the inputs are nearly identical. Every wearable that claims to measure recovery or readiness uses a combination of the following signals.
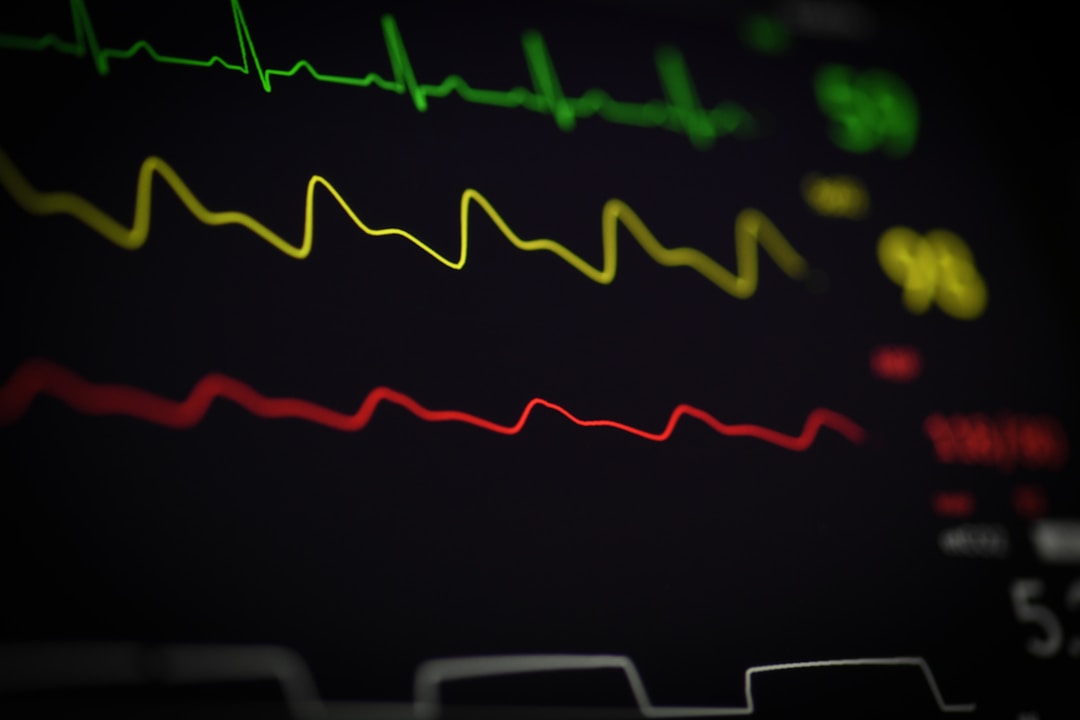
Heart rate variability, measured as the root mean square of successive differences between heartbeats, or RMSSD. This is the standard metric for autonomic balance. A high RMSSD suggests parasympathetic dominance, which is associated with rest. A low RMSSD suggests sympathetic dominance, which is associated with stress. The problem is that RMSSD is highly variable. It changes with posture, breathing, caffeine, alcohol, menstrual phase, and time of day. A single nightly average is not enough to capture the full picture, but that is what most wearables use because the sensor only samples reliably during sleep.
Sleep duration and sleep stage distribution. Most wearables estimate sleep stages from movement and heart rate. They do not measure brain activity. They guess. The guesses are better than nothing, but they are still guesses. A device that reports 90 minutes of REM sleep might be off by 30 minutes in either direction. That error propagates into the recovery score because the score weights deep sleep and REM sleep differently. Oura weights deep sleep heavily. Whoop weights sleep consistency heavily. Garmin weights sleep duration heavily. The weighting choices are not published in detail, so you cannot verify whether they are correct for your body.
Resting heart rate, typically the lowest heart rate measured during a sleep window. This is a robust metric. It correlates with fitness, fatigue, and illness. A resting heart rate 10 beats above your baseline is a strong signal that something is wrong. The problem is that the baseline is computed by the wearable company, not by you. Oura computes a 14-day rolling average. Whoop computes a 30-day rolling average. Garmin computes a 7-day rolling average. If you have a slow week, your baseline drops, and your next normal week looks like overreaching. The baseline is the lens, and the lens is invisible.

Some devices add secondary inputs. Oura adds skin temperature trend. Garmin adds all-day stress tracking, which is itself derived from HRV. Whoop adds strain, which is a cumulative measure of heart rate zones during the day. But the core of every score is HRV, sleep, and resting heart rate. Those three signals are the only ones that every device measures with enough consistency to build a score around. The rest is decoration.
Why the scores converge on the same number
If you wear an Oura Ring and a Whoop strap on the same night, the readiness and recovery scores will correlate. Not perfectly, but strongly. Studies have shown correlations of 0.6 to 0.8 between HRV-derived scores from different devices. That is high enough that the scores are telling you the same thing, but low enough that you cannot trust either one as ground truth.
The convergence happens because the math is similar. All three devices use a z-score or percentile approach. They take your nightly HRV, compare it to your personal baseline, and map the deviation to a 0 to 100 scale. The mapping is non-linear. A small deviation near the mean might drop your score by 10 points. A large deviation might drop it by 30. The non-linearity is supposed to reflect the real-world impact of autonomic disturbance, but the curve is drawn by the company, not by physiology.
Oura says its readiness score combines HRV, sleep, and temperature into a holistic picture. The word holistic is doing a lot of work there. It means the inputs are weighted and summed. The weights are proprietary. They might be 40 percent HRV, 30 percent sleep, 20 percent resting heart rate, and 10 percent temperature. They might be different. Oura does not say. The user gets a number and a color. Neither is the ground truth of your physiological state.
Whoop is more explicit about its recovery formula. The score is 50 percent HRV, 25 percent resting heart rate, and 25 percent sleep performance. Those percentages are from their 2019 blog post. They might have changed. Whoop does not publish updates. The sleep performance component is itself a composite of sleep duration, sleep efficiency, and sleep consistency. By the time the math reaches the user, the original signal has been through three layers of abstraction. The user sees a percentage. The percentage is a summary of a summary of a summary.
Garmin Body Battery is more dynamic. It updates throughout the day, not just in the morning. The real-time aspect is a genuine differentiator. The inputs are still the same. Garmin uses HRV stress data to estimate autonomic load, sleep data to estimate restoration, and activity data to estimate expenditure. The result is a battery metaphor that drains and fills. The metaphor is accurate in one sense: your energy is finite. It is inaccurate in another: your body does not recharge linearly during sleep. The first two hours are more restorative than the last two. Garmin's model does not account for that.

What the scores miss
This is the part the marketing does not cover. The scores are built from optical heart rate and accelerometer data. They cannot measure what matters most for actual recovery.
Muscular recovery is invisible to HRV. If you squat heavy on Monday, your quadriceps are damaged at the sarcomere level. That damage peaks 24 to 48 hours after the workout. Your HRV might look fine on Tuesday morning because your autonomic nervous system is not directly affected by muscle soreness. Your readiness score might be 90. Your legs are still destroyed. The device is not wrong about HRV. It is wrong about recovery because recovery is not just HRV.
Central nervous system fatigue is also invisible. CNS fatigue comes from high-intensity training, skill work, or cognitive load. It manifests as slower reaction times and reduced power output. HRV can sometimes detect it, but only if the fatigue is severe enough to shift autonomic balance. Mild CNS fatigue does not show up in RMSSD. It shows up in your vertical jump or your grip strength. No wearable measures those directly.
Nutrition and hydration are missing. A dehydrated athlete has thicker blood, lower stroke volume, and higher heart rate at the same workload. The wearable sees the higher heart rate and interprets it as higher strain. It does not know you drank two coffees and no water. A glycogen-depleted athlete has higher perceived exertion. The wearable sees the higher heart rate and interprets it as higher strain. It does not know you skipped breakfast. The inputs are blind to the two most important recovery variables.
Psychological stress is partially visible. HRV drops during acute stress. Chronic stress is more complicated. Some people show low HRV during burnout. Others show normal HRV because their nervous system has adapted. The wearable cannot distinguish between a stressful job and a hard workout. The score treats them as the same input. They are not. The wearable sees stress. It does not see context.
Why the names matter more than the numbers
The branding of these scores is not neutral. It shapes how users think about their bodies.
Readiness implies a binary state. You are ready or you are not. This is a performance framing. It is useful for athletes who need to decide whether to train hard or back off. It is less useful for people who are not training for a competition. A parent who slept four hours because their child was sick does not need a readiness score. They need a nap. The score of 45 adds anxiety to an already stressful morning. The number is accurate in a narrow sense. It is cruel in a broader sense.
Recovery implies a process. You are recovering or you are not. This is a medical framing. It suggests that the body is repairing itself and that the score measures the progress of that repair. The framing is accurate for acute recovery from a specific workout. It is misleading for chronic training. An athlete in a heavy training block is never fully recovered. Their HRV is chronically suppressed. Their recovery score is chronically yellow. The device tells them they are not recovering. Their coach tells them this is normal for the phase. The user is stuck between two authorities. The device has the advantage of being a number. The coach has the advantage of being right.
Body Battery implies a resource. You have energy or you do not. This is a consumer gadget framing. It is the most honest of the three because it does not pretend to be medical or athletic. It is a metaphor. The problem is that the metaphor breaks down under scrutiny. A battery drains at a constant rate. Your body does not. A battery fills at a constant rate. Your sleep does not. The metaphor is useful for casual users who want a simple signal. It is dangerous for serious users who might make training decisions based on it.
The psychological effect is real. Users report anxiety when their score drops. They report guilt when they train hard on a low-score day. They report relief when the score rebounds. These emotions are not caused by the physiology. They are caused by the interface. The wearable is not measuring your body. It is measuring your HRV and sleep, then packaging the result in a way that triggers a specific emotional response. Anxious users check the app more often. Guilty users buy the premium features. Relieved users post screenshots on social media. The score is a retention mechanism disguised as health data.
How Pulsyn handles this differently
We do not compute a proprietary recovery score. We do not compute a readiness score. We do not compute a strain score. We show you the raw inputs and let you decide what they mean.
The Pulsyn app displays your HRV as a time series. You can see your nightly RMSSD trend over the past week, month, or year. We do not average it into a single number. We do not compare it to a hidden baseline. We show you the distribution. You can see whether your HRV is stable, trending up, or trending down. That variation is the signal. Averaging it away is the loss.
The app displays your sleep data as a hypnogram. You can see the actual sleep stage estimates, with the caveats that they are estimates. We label the uncertainty. We do not hide the fact that the device guesses sleep stages from movement and heart rate. We show the guess and explain the margin of error. If you want to know your real sleep architecture, you need a polysomnogram in a lab. The ring is a convenient proxy, not a substitute.
The app displays your resting heart rate as a single number with a trend line. We compute the baseline transparently. We use a 7-day rolling median, not a hidden average. We explain why we chose 7 days instead of 14 or 30. We explain that the baseline shifts with training, illness, and lifestyle changes. It is a statistical convenience, and we treat it as one.
We do not wrap these inputs in a proprietary score because the inputs are yours. Your HRV is yours. Your sleep is yours. Your heart rate is yours. Turning them into a number that we own and you do not is a power move disguised as a feature. The score is proprietary. The algorithm is secret. The thresholds are arbitrary. The user is dependent. That is the business model. We are not doing it.
The on-device AI can help you interpret the data if you enable the premium tier. It does not give you a score. It gives you plain text. Your HRV was 15 percent below your 7-day median last night. Possible reasons: hard training, alcohol, late caffeine, or poor sleep. That is a description, not a diagnosis. It is honest about what it knows and what it does not. The AI runs on your phone, not in the cloud, so the analysis stays local along with the data.
We do not claim that raw data is better than a score for everyone. Some users want a simple signal. The raw data approach requires more engagement. It requires learning what HRV means for your body. It requires accepting uncertainty. We think that engagement is better than dependence. We might be wrong. The market has voted for scores so far. But the market also voted for subscriptions, and we are not doing that either.
What we are still figuring out
I want to be honest about the limitations. Pulsyn does not measure muscular recovery. We do not measure CNS fatigue. We do not measure nutrition or hydration. The ring measures the same three inputs as every other wearable. The difference is in what we do with those inputs, not in what we can measure.
We are exploring whether the open API can solve the muscular recovery problem. If you log your training in a connected app, and that app sends load data to Pulsyn, we could combine the internal load with the external load to give you a more complete picture. The API exists. The integrations do not yet. That is a real gap.
We are also exploring whether the skin temperature sensor can add useful context. A gradual temperature rise during a training block might indicate inflammation. A gradual temperature drop might indicate overreaching. The literature is thin. The signal is noisy. We are collecting the data and publishing what we find.
The honest truth is that no wearable can tell you whether you are recovered. Recovery is a multidimensional state that includes muscular, neural, metabolic, and psychological components. The best tools for measuring it are a training log, a vertical jump test, a grip strength test, and an honest conversation with your body. The ring can give you one dimension. That dimension is valuable. It is not the whole picture. Any company that claims otherwise is selling something.
About the author
James Hoffmann is the founder of Pulsyn. He has been tracking his own HRV and sleep data for three years across six different wearables, and he is still not sure what a readiness score of 78 actually means.
References
- Oura Health Oy (2021). The Oura Readiness Score: A Novel Method for Assessing Daily Recovery. Oura Blog.
- WHOOP Inc. (2019). How WHOOP Calculates Recovery. WHOOP The Locker.
- Garmin Ltd. (2022). Body Battery Energy Monitoring: Technical White Paper. Garmin Developer Blog.
- Plews, D. J., et al. (2013). Heart-rate variability and training intensity distribution in elite rowers. International Journal of Sports Physiology and Performance, 8(3), 284-291.
- Bourdon, P. C., et al. (2017). Monitoring athlete training loads: consensus statement. International Journal of Sports Physiology and Performance, 12(S2), S2-161-S2-170.
- Earle, D. J., et al. (2022). Correlation between consumer wearable recovery scores and objective markers of neuromuscular fatigue. Journal of Sports Sciences, 40(14), 1623-1631.