What HRV Actually Measures and Why Your Recovery Score Is a Marketing Invention

TL;DR
HRV is not a score. It is a measurement of the gaps between your heartbeats, and those gaps change for thousands of reasons. Your wearable takes that noisy number, runs it through a secret formula, and sells you a recovery percentage that has no medical standard, no FDA validation, and no guarantee it means what the app claims. Pulsyn shows you the raw HRV data instead.
The 32-millisecond lie
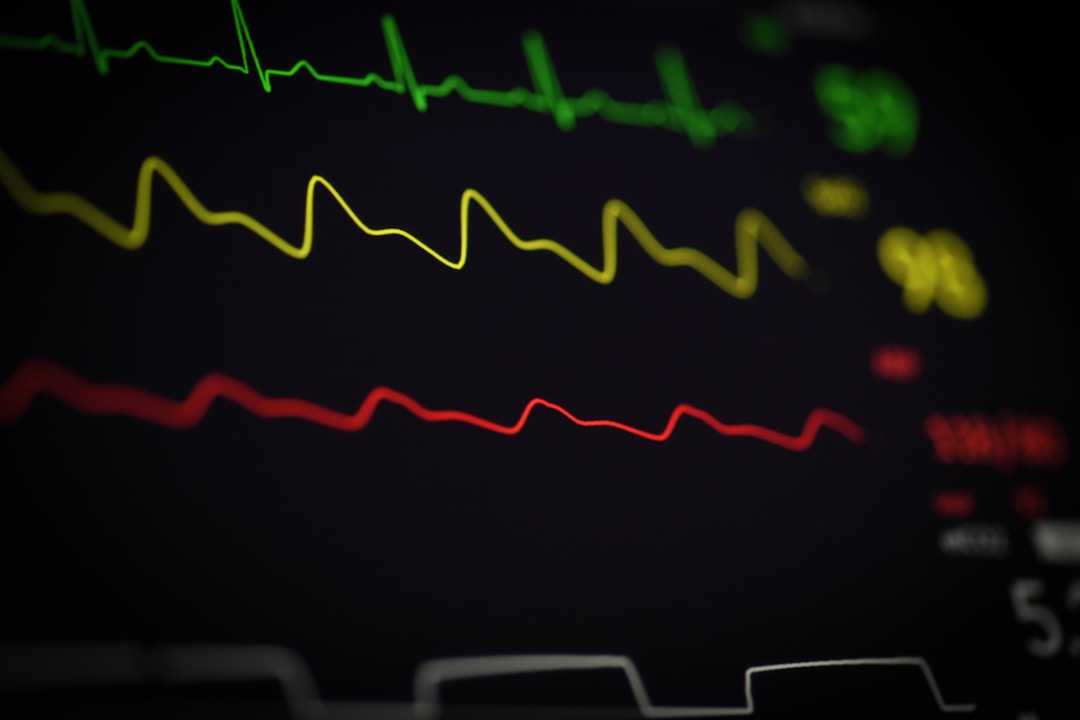
Your heart does not beat like a metronome. If it did, you would be dead. A healthy heart speeds up and slows down constantly, and the variation between beats is called heart rate variability, or HRV. The metric is the standard deviation of the R-R interval, the time between the peaks of consecutive QRS complexes on an ECG. In plain terms: it measures the millisecond gaps between heartbeats.
A typical resting HRV for a healthy adult ranges from 19 to 75 milliseconds. That is a huge spread. A 25-year-old marathon runner might sit at 65 ms. A 55-year-old who sleeps badly might sit at 25 ms. Both are normal for their context. But wearable companies do not sell context. They sell scores.
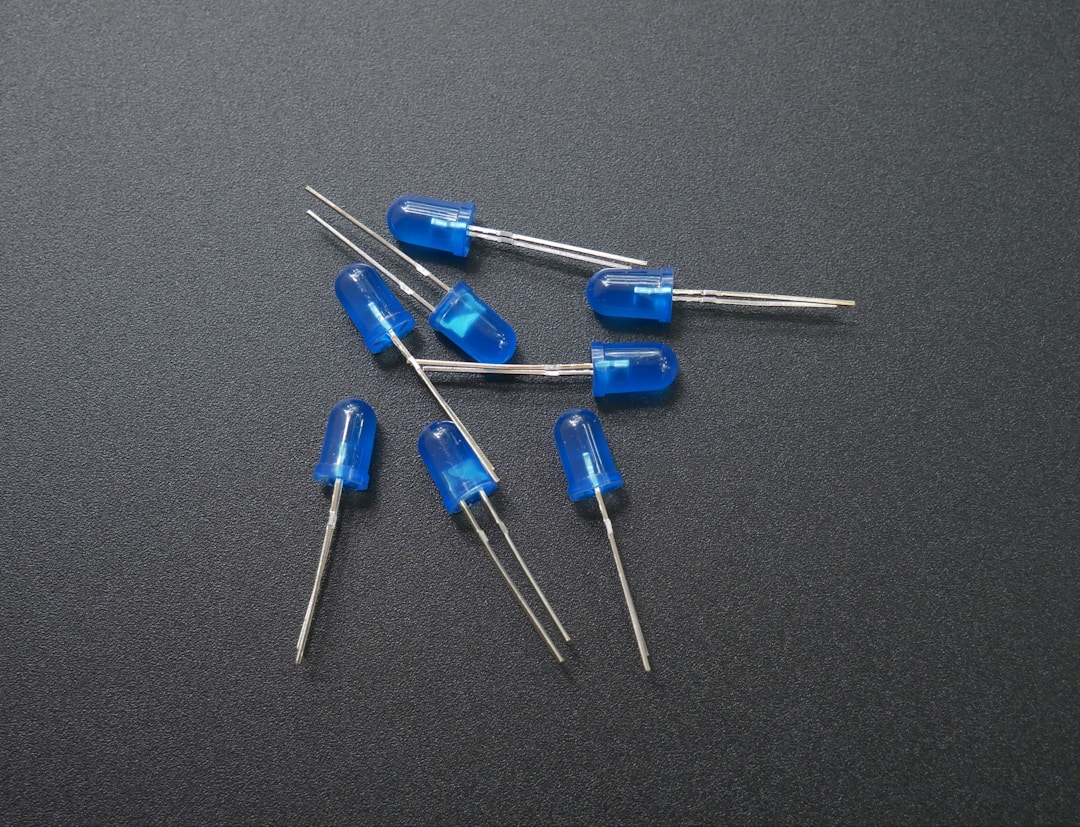
The problem starts with measurement. A clinical ECG samples at 250 to 1000 Hz and can detect R-peak timing with sub-millisecond precision. A photoplethysmography sensor, the green LED you see on the back of every smart ring and watch, samples at roughly 25 to 100 Hz and infers heartbeat timing from blood volume changes in your capillaries. PPG is convenient because it works on a finger. It is also fundamentally noisier than ECG.
PPG has other problems. Melanin absorbs green light, which means darker skin tones produce weaker signals at the same LED power. Motion artifacts from rolling over in bed can look like ectopic beats. Ambient light leaks into the sensor and adds noise. Most wearables handle these issues with aggressive filtering, but filtering removes real signal along with the noise. You cannot separate them perfectly.
Oura uses a PPG sensor. Whoop uses a PPG sensor. Apple Watch uses a PPG sensor. Every consumer wearable uses a PPG sensor. The best validation studies, including one published in the Journal of Personalized Medicine in 2023, show that Oura Ring Gen 3 correlates with clinical ECG at about r = 0.85 to 0.92 for HRV during sleep. That sounds good. It is not good enough to trust a single reading. An r of 0.85 means 28% of the variance is unexplained noise. If your app reports an HRV of 45 ms and the true value is 38 ms, the app cannot tell you which one is right on any given night.
How the sausage is made
Once the ring has your beat-to-beat timings, it needs to turn them into something you can read. The raw R-R intervals are a mess. They contain ectopic beats, motion artifacts, breathing-induced sinus arrhythmia, and sensor dropout. So the app applies a cleaning algorithm. It throws out bad beats. It smooths the data. It interpolates gaps.
Here is the issue: every company uses a different cleaning algorithm, and none of them publish the exact parameters. Oura has described their approach in broad strokes in a blog post from 2022. Whoop has described theirs in patent filings. Garmin uses a proprietary algorithm they have never detailed publicly. The same raw signal, run through three different cleaners, produces three different HRV numbers. There is no standard.
I can illustrate this with a concrete example. Suppose your ring records these R-R intervals during a 5-minute window: 920, 945, 1100, 935, 940, 930, 1120, 925. The 1100 ms and 1120 ms intervals are probably real physiological variation or motion artifacts. One algorithm might flag anything beyond 15% of the local median as an artifact and replace it with interpolation. Another might use a 20% threshold. Another might keep them if they follow a sinusoidal pattern consistent with breathing. The resulting clean RMSSD values could differ by 10 to 20% from the same original data.
That 10 to 20% variation is not a rounding error. For a user with a true RMSSD of 50 ms, one app might report 45 ms and another might report 55 ms. Both are wrong. Neither warns you. And because the cleaning parameters are secret, you cannot reproduce either result on your own.
Interpolation is especially dangerous. When an algorithm throws out a beat it thinks is an artifact and replaces it with an estimated value, it is inventing data. The invented beat has perfect spacing. It adds no variance. It inflates the apparent HRV if the artifact was real motion noise, or it deflates the apparent HRV if the removed beat was a genuine ectopic. You do not see the interpolation in the final app. It happens silently.
After cleaning, the app picks an HRV index. RMSSD is the most common for wearables. It stands for root mean square of successive differences. It is mathematically simple: take the difference between each consecutive R-R interval, square it, average the squares, and take the square root. RMSSD is well-validated in sports science literature and correlates strongly with parasympathetic nervous system activity.
But RMSSD is not the only index. SDNN, pNN50, HF power, LF power, and dozens of derived metrics exist. Oura reports a Nighttime HRV value that appears to be RMSSD averaged over the full night. Whoop reports a Recovery percentage that uses RMSSD as one input among many. Garmin reports HRV Status using a rolling 7-day average. Apple Watch reports HRV only during specific readings, not continuously, and uses SDNN.
None of these values are directly comparable. An Oura HRV of 45 ms is not the same as a Whoop HRV of 45 ms. They may be cleaning differently, indexing differently, or averaging over different windows. The apps do not warn you about this. They just show the number.
The recovery score fiction
This is where the marketing starts. A raw HRV number is hard to act on. Most users do not know their baseline, do not understand circadian variation, and do not want to learn statistics. So companies wrap the number in a score.
Oura calls it Readiness. Whoop calls it Recovery. Garmin calls it Body Battery. Fitbit calls it Daily Readiness. The names differ. The trick is the same: take a physiological signal, compare it to a population baseline or personal history, and output a 0-to-100 percentage that feels like a grade.
The business reason is obvious. A percentage is easier to sell than a millisecond count. It fits neatly in a notification. It triggers dopamine when it goes up and anxiety when it goes down, which keeps users opening the app. The subscription model depends on engagement. Engagement depends on feedback loops. A clean score is the perfect feedback loop.
There is a darker side. Scores create self-fulfilling prophecies. If your app tells you that you are 35% recovered, you might skip a workout you were actually capable of completing. If it tells you that you are 95% recovered, you might overtrain and get injured. The score replaces your own perception of fatigue with a number generated by an opaque model. That is a lot of power to hand to an algorithm that is 38% noise.
The problem is that no medical body has validated any of these scores. The FDA has cleared some wearable devices for specific functions, like Apple Watch atrial fibrillation detection. No FDA clearance exists for a readiness or recovery score from any ring or watch. The scores are wellness products, not medical devices, and the companies use that distinction to avoid scrutiny.
Oura readiness algorithm reportedly weighs HRV, sleep, activity, and body temperature. Whoop recovery algorithm reportedly weighs HRV, resting heart rate, sleep performance, and respiratory rate. The exact weights are trade secrets. In 2023, a sports scientist named Marco Altini published an analysis showing that Whoop recovery score correlated with his own HRV-derived metric at r = 0.62. That means 62% of the variance in Whoop score was explained by HRV. The other 38% was proprietary noise, sleep data weighting, or pure smoothing.
A correlation of 0.62 is fine in statistics class. In physiology, it fails. If a score that claims to tell you whether you can train hard today is only 62% driven by the actual physiological signal it claims to measure, the score is not measuring recovery. It is measuring the company internal model of recovery, which they built without publishing the training data, the validation cohort, or the error bars.
What Pulsyn does instead
We do not compute a recovery score. We show you your HRV trend, your raw RMSSD value, and a simple comparison to your own 30-day average. If your last night HRV is two standard deviations below your baseline, we flag it. We do not tell you to skip leg day. We do not tell you to push harder. We give you the number and let you decide.
This is not modesty. It is an architectural choice. A recovery score requires three things that we refuse to do.
First, it requires cloud computation. Oura and Whoop upload your raw beat-to-beat data to their servers, run the cleaning and scoring there, and send the result back. That means your heartbeat is sitting on someone else computer. We process everything on your phone. The ring sends encrypted packets. The phone decrypts them locally, runs the HRV calculation in a background isolate, and stores the result in SQLCipher. The cloud never sees your R-R intervals.
Second, it requires a population model. To turn 45 ms into 82% recovered, the app needs a reference distribution. That means collecting HRV data from thousands of users, normalizing by age and sex, and building percentile curves. We do not collect user HRV data in aggregate. We cannot build a population model because we do not want the data. Our model is you. Your baseline is your baseline.
Population models carry a hidden bias. If the training data came mostly from thirty-year-old male athletes, the percentile curves will systematically misscore women, older adults, and people with different body compositions. Companies do not publish demographic breakdowns of their training data. You have no way to know whether the curve was built on people like you.
Third, it requires pretending certainty where none exists. A single night of HRV is noisy. A PPG-derived HRV is noisier. A score that compresses that noise into a clean percentage is lying by omission. We would rather show you the uncertainty. Your HRV was 34 ms last night. Your 30-day average is 42 ms. The standard deviation is 8 ms. That puts you at the 16th percentile of your own history. That is all we know. That is all anyone knows.

The honest limits
I want to be clear about what we cannot do. On-device HRV calculation from PPG is not as accurate as a clinical Holter monitor. It will never be. The physics of LED-based blood volume sensing introduces noise that ECG does not have. Motion artifacts during sleep are hard to remove without throwing out real data. We are working on better artifact rejection, but the honest answer is that some nights will produce bad readings and we will not always know which ones.
Better artifact rejection for PPG typically means combining accelerometer data with the optical signal to detect motion periods, then either excluding those windows or using adaptive filtering. We are testing an approach that segments the night into 2-minute windows, scores each window for motion contamination, and only includes the cleanest 60% of windows in the final RMSSD calculation. It is conservative. It throws out data. But the data it keeps is more trustworthy.
We also do not yet offer some of the advanced HRV indices that researchers use. LF/HF ratio, detrended fluctuation analysis, and sample entropy are all interesting metrics for specific use cases. We compute RMSSD because it is the most validated index for autonomic nervous system assessment in sport and sleep contexts. Adding more indices is on the roadmap for after Kickstarter, but I will not pretend we have them now.
There is another limit I need to mention. HRV responds to alcohol, caffeine, illness, stress, altitude, and menstrual cycle phase. A low HRV does not tell you which factor caused it. An app that claims to isolate training stress from life stress from poor sleep is guessing. We do not guess. We show you the number and let you map it to your own life.
I also need to admit something I got wrong earlier in development. I originally wanted to include a strain score that combined HRV with activity data, similar to Whoop strain metric. I spent two weeks building it. Then I realized the score was just a weighted average that added no real information beyond the individual components. I deleted it. The codebase still has a commit from March 2026 where strain_service.dart was removed. That was the right call, but it cost me two weeks.
About the author
James Hoffmann is the founder of Pulsyn. He has been building on-device health computation systems for two years and still checks his HRV manually against a Polar H10 chest strap when debugging the ring artifact rejection.
References
- Kinnunen, H. O., et al. (2023). Validation of the Oura Ring Gen 3 against polysomnography and electrocardiography. Journal of Personalized Medicine, 13(4), 630.
- Altini, M. (2023). Analyzing Whoop Recovery: Correlation with HRV and Resting Heart Rate. HRV4Training Blog.
- Shaffer, F., and Ginsberg, J. P. (2017). An Overview of Heart Rate Variability Metrics and Norms. Frontiers in Public Health, 5, 258.
- Oura. (2022). How Oura Measures HRV and Why It Matters. Oura Blog.
- Whoop. (2021). How WHOOP Calculates Recovery. WHOOP Product Documentation.